Custom KPIs
You can create your own custom KPIs and monitor data that is not covered by default KPIs. The complete process of custom KPI creation up until the execution of its monitoring is explained in the chapter The Complete Process of Custom KPI Creation and Data Collection.
You can alter the settings of custom KPIs as described in the chapter Defining a Custom KPI.
The technical name of a custom KPI starts with Y* or Z*. For more information about displaying custom KPIs, see the chapter Displaying KPIs.
The following chapters provide additional information about how to:
-
Create KPI groups to facilitate navigation and maintenance.
-
Display further details about custom KPIs, as described in the chapter KPI Details Displayed in a Detail Table.
The Complete Process of Custom KPI Creation and Data Collection
This chapter provides an overview of the process of custom KPI creation and data collection. The complete process guides you through the individual steps and helps you to create a custom KPI according to your preferences.
1. Check Default and Custom KPIs
Before you create a custom KPI, you must first check whether the default or custom KPIs already track values that are important for you.
You must check:
-
Default KPIs
KPIs that are delivered with CrystalBridge® Monitoring. For more information about default KPIs and the list of all delivered default KPIs, see the chapter Default KPIs.
-
Custom KPIs
KPIs that you or other users have created before. The technical name of these KPIs starts with a capital Y* or Z*.
You can display a list of both default and custom KPIs, as described in the chapter Displaying a List of All KPIs.
If you find a KPI that fulfills your requirements, you do not need to create a custom KPI. If not, follow the instructions below:
2. Create a Custom KPI
There are several ways to create a custom KPI:
-
Create a KPI from an existing KPI based on a calculation function
-
Create a KPI through an SQL SELECT statement
-
Create a KPI through collectors with a custom KPI
-
Create a KPI with a custom collector in ABAP
For a full description of the KPI creation methods and their dependencies on the collectors, see the chapter Creating a Custom KPI.
Create Detail Tables for Custom Collectors or the Collector for User-defined SQL (optional)
A detail table is a specific table of a collector that contains further information about a KPI. For more information, see the chapter KPI Details Displayed in a Detail Table.
3. Define a Monitoring Profile for a KPI
Defining a monitoring profile enables you to group several KPIs together and monitor them all at once.
You can create new profiles or maintain existing profiles.
For more information, see the chapter Defining Monitoring Profiles for KPIs.
4. Schedule the Monitoring of KPIs
For information about scheduling the KPI monitoring, see the chapter Scheduling the Monitoring of KPIs.
Creating a Custom KPI
There are several ways to create and set your custom KPI for monitoring. The following methods are sorted from the simplest method to the most advanced one.
To display more information about the specific method, click its name.
Create a KPI from an existing KPI based on a calculation function
Use this method if you find an existing KPI from which you can specify your custom KPI based on a calculation function. This method is mainly used for adjusting the existing KPIs, for example a sum of KPI values, finding the maximum value of the KPIs, etc.
Create a KPI through an SQL SELECT statement
Use this method if you require a KPI that is not included in the default KPIs or if the first method does not fulfill your requirements. The advantage of this method is that you can create a custom KPI by specifying an SQL SELECT statement.
Create a KPI through collectors with a custom KPI
Use this method if you require a KPI that cannot be created with an SQL statement. CrystalBridge® Monitoring includes programs (collectors with a custom KPI) for which you can define data sets that are collected in a custom KPI.
Create a KPI with a custom collector in ABAP
Use this method only if you require a KPI that cannot be created with the previous steps. This method requires advanced ABAP knowledge because you must implement the collector program by yourself.
You can find an overview of the complete process of custom KPI creation in the chapter The Complete Process of Custom KPI Creation and Data Collection.
Creating a KPI from an Existing KPI Based on a Calculation Function
This chapter explains how to create a KPI from an existing KPI and provides more details about calculation functions. For more detailed information, see the chapter Creating a KPI from an Existing KPI.
It is possible to create a custom KPI that is calculated from an already existing KPI.
The source KPI can be one of the following:
-
A default KPI that is included in the CrystalBridge® Monitoring delivery. You can find a list of these KPIs with a short description in the chapter Complete List of Default KPIs.
-
A custom KPI, which you can create in several ways. You can find a list of the custom KPIs with their descriptions in the chapter Displaying a List of All KPIs.
The calculation from the source KPI is performed according to the following functions:
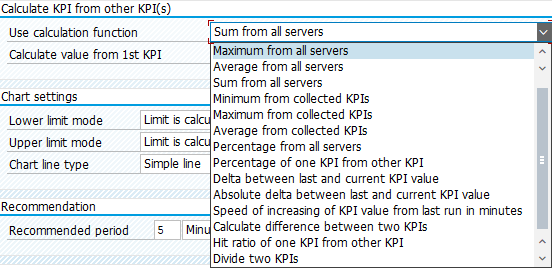
The following table provides an explanation of the calculation functions:
|
Calculation function |
Source KPIs necessary for the calculation and their type |
Description |
Resulting KPI type |
|---|---|---|---|
|
Minimum from all servers |
First source KPI – server |
Minimum server values defined by the first source KPI. |
System KPI |
|
Maximum from all servers |
First source KPI – server |
Maximum server values defined by the first source KPI. |
System KPI |
|
Averages from all servers |
First source KPI – server |
Average server values defined by the first source KPI. |
System KPI |
|
Sum from all servers |
First source KPI – server |
Sum of server values defined by the first source KPI. |
System KPI |
|
Minimum from collected KPIs |
First source KPI – server or system |
Minimum server and system values defined by the first source KPI, which were collected over the last 48 hours. |
Server or system KPI |
|
Maximum from collected KPIs |
First source KPI – server or system |
Maximum system or server values defined by the first source KPI, which were collected over the last 48 hours. |
Server or system KPI |
|
Average from collected KPIs |
First source KPI – server or system |
Average system and server values defined by the first source KPI, which were collected over the last 48 hours. |
Server or system KPI |
|
Percentage from all servers |
First source KPI – server |
Server value of the first source KPI divided by the sum of all server values of this KPI. |
Server KPI |
|
Percentage of one KPI from other KPI |
First and second source KPI – server or system |
Ratio of the server or system value defined by the first source KPI and the server or system value defined by the second source KPI. |
Server or system KPI |
|
Delta between last and current KPI value |
First source KPI – server or system |
Delta between the server or system value defined by the first source KPI collected in the current run and the same first source KPI collected in the previous run. |
Server or system KPI |
|
Absolute delta between last and current KPI value |
First source KPI – system or server |
Absolute value of the delta between the server and system value defined by the first source KPI collected in the current run and the same first source KPI collected in the previous run. |
Server or system KPI |
|
Speed of increasing of KPI value from the last run in minutes |
First source KPI – server or system |
Delta between the server or system value defined by the first source KPI collected in the current run and the same first source KPI collected in the previous run divided by the time difference between both runs. |
Server or system KPI |
|
Calculate the difference between two KPIs |
First and second source KPI – server or system |
Difference between the server or system values defined by the first source KPI and the system or server values defined by the second KPI. |
Server or system KPI |
|
Hit ratio of one KPI from other KPI |
First and second source KPI – server or system |
Hit ratio between the values defined by the first source KPI (number of hits) and the second source KPI (total content requests) collected in the current run. |
Server or system KPI |
|
Divide two KPIs |
First and second source KPI – server or system |
Divides the value defined in the first source KPI by the value defined in the second source KPI. |
Server or system KPI |
You can find more information in the chapter Example: Number of Active Users on the System.
Creating a KPI from an Existing KPI
This chapter provides instructions on how to create a KPI from an existing KPI. For a brief description of the process and the calculation functions, see the chapter Creating a KPI from an Existing KPI Based on a Calculation Function.
Proceed as follows to create a custom KPI from an already existing KPI:
Create a custom KPI name and define how your custom KPI is displayed.
-
Start transaction /DVD/MON and click Settings > Monitoring settings. Alternatively, you can start transaction /DVD/MON_CUST.
-
Double-click KPI definitions.
-
Click New Entries.
-
Fill out all the required fields as shown in the figure below and click Save.
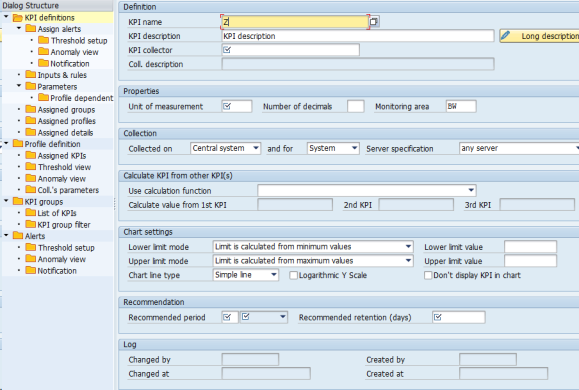
Definition
-
KPI name: Specifies the case-sensitive name of a custom KPI.
NOTE Your KPI name must start with a capital Y* or Z* because the standard customizing (field entries except the ones starting with Y* or Z*) cannot be changed or added.
-
KPI description: Specifies the description that is used as the KPI label in the KPI charts and other output.
-
Long description (optional): Specifies the long description of a KPI that is displayed in the KPI information pop-up and the KPI charts.
-
KPI collector: Determines which collector collects the KPI. To create a KPI from another KPI, enter the collector of the source KPI.
Properties
-
Unit of measurement: Specifies the unit of measurement that is displayed next to the KPI value in the KPI chart.
-
Number of decimals: Specifies the number of decimals that are displayed in the KPI chart. An empty field means that no decimals are displayed.
-
Monitoring area: Specifies the system type that is specific for the KPI. KPIs are only collected for specific system types, such as ERP, BW, CRM, SRM, etc.
Collection
-
Collected on: Specifies the system on which the KPI is collected or calculated. To create a KPI from another KPI, select Central system.
-
and for: Determines whether the KPI value is calculated for a system or at the server level. Select the level for which the resulting KPI must be collected.
EXAMPLE For example, the KPI Size of a table is a system KPI, while the KPI CPU load is a server-dependent KPI.
-
Server specification: Allows you to select a server type if you have selected Server in the above field and for. You can choose among the following server types:
-
Any server
-
Only application server
-
Only database server
-
Only external server
-
Calculate KPI from other KPI(s)
This area allows you to create a KPI from already existing KPIs.
-
Use calculation function: Allows you to select one of the calculation functions.
You can find a complete description of the calculation functions in the chapter Creating a KPI from an Existing KPI Based on a Calculation Function. -
Calculate value from 1st KPI: Specifies the first source KPI. Choose a default or a custom KPI.
-
2nd KPI: Specifies the second source KPI. The second KPI is only used for the calculation functions Percentage of one KPI from other KPI and Calculate the difference between two KPIs.
NOTE To display all KPIs that can be used as source KPIs, click Settings > Monitoring settings and double-click KPI definitions. The technical names of custom KPIs start with a capital Y* or Z*.
To display the list of default KPIs with their description, see the chapter Complete List of Default KPIs.
Chart settings (optional)
This area allows you to set the lower and upper limits for displaying your KPI chart.
-
Lower/Upper limit mode: Specifies the mode according to which your KPI chart is displayed:
-
Limit is calculated from minimum/maximum values
-
Limit is a fixed value
-
Limit is calculated from fixed and minimum/maximum values
-
-
Lower/Upper limit value: Specifies the value of the selected limit mode, based on which your KPI is displayed in your KPI chart.
-
Chart line type: Specifies the type of chart line. The following options are available:
-
Simple line
-
Spline line
-
Discrete line
-
-
Logarithmic Y scale: If selected, Y-axis labels are shown as values of the common logarithm (decimal), i.e. as a logarithmic scale instead of a linear one.
-
Don't display KPI in charts: If selected, the KPI is not displayed in the KPI charts or the KPI group list. For example, you can select this field if you want to use the KPI value for other KPI calculations or aggregations.
Recommendation (optional)
-
Recommended period: Displays a recommendation for how often the KPI should be collected. This field serves only as information for other users about the period they should enter when starting the monitoring of this KPI.
-
Recommended retention (days): Displays a recommended time for the storage of KPI data in the system before this data is deleted. This field serves only as information for other users about the retention time that they should specify when scheduling the monitoring of this KPI.
EXAMPLE If you choose the recommended period of 5 minutes, then the recommended retention time is 31 days. For a collection period of 24 hours, the recommended retention time is 365 days.
Log
-
Changed by: Displays the last user who changed the KPI definition.
-
Changed at: Displays the time of the last change.
-
Created by: Displays the user who created the KPI definition.
-
Created at: Displays the time of the creation.
After you save your custom KPI, the next step is to assign this KPI to a monitoring profile. You can use the monitoring profile that is assigned to the source KPI or create a new one. For more information, see the chapter Defining Monitoring Profiles for KPIs.
In addition, you can find an example in the chapter Example: Number of active users on the system.
In AppDynamics, CrystalBridge® Monitoring KPIs are mapped to metrics. It is possible to create metric expressions from other existing metrics when defining widget data. For more information, see in the chapter Widget Data in the AppDynamics documentation.
Example: Number of Active Users on the System
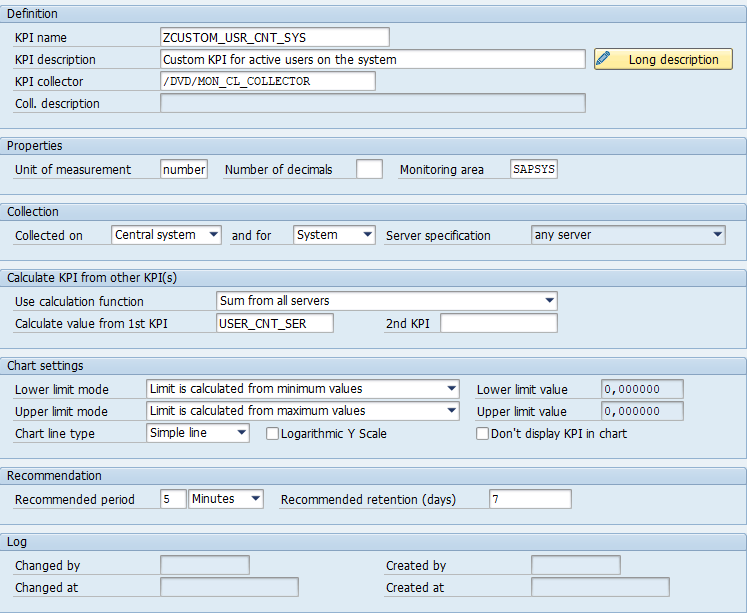
This example shows how to create your own KPI from an existing KPI to monitor all active users on the system. The existing KPI USER_CNT_SER collects information about the number of active users per server. You can use the calculation function to calculate the sum of all servers of the source KPIs.
Creating a Custom KPI
-
Start transaction /DVD/MON and click Settings > Monitoring settings. Alternatively, you can start transaction /DVD/MON_CUST.
-
Click New Entries.
-
Fill out all the required fields for the custom KPI as shown in the figure below:
-
In the KPI name field, enter ZCUSTOM_USR_CNT_SYS.
-
In the KPI description field, enter a unique description.
-
In the KPI collector field, enter /DVD/MON_CL_COLLECTOR. This is the standard collector that is used to create a KPI from an existing KPI.
-
In the Unit of measurement field, enter Number.
-
In the Monitoring area field, enter SAPSYS.
-
In the Collected on drop-down menu, select Central system. The calculation functions can be performed only on the central system, as on the central system, all the collected values for other KPIs are available.
-
In the Use calculation function drop-down menu, select Sum from all servers.
-
In the Calculate value from first KPI field, enter USER_CNT_SER.
-
Other fields should be filled as shown in the figure below. For a complete description, see the chapter Creating a KPI from an Existing KPI
-
-
Click Save.
Creating a Monitoring Profile for a Custom KPI
-
Start transaction /DVD/MON and click Settings > Monitoring settings. Alternatively, you can start transaction /DVD/MON_CUST.
-
Double-click Profile definition.
-
Click New Entries.
-
Enter ZCUSTOM as the profile name.
-
Double-click Assigned KPIs.
-
Click New Entries.
-
Enter ZCUSTOM_USR_CNT_SYS as the custom KPI name.
-
Click Save.
-
The custom KPI ZCUSTOM_USR_CNT_SYS is now assigned to the valid monitoring profile ZCUSTOM.
Scheduling the Monitoring of a Custom KPI
The last step is to execute the monitoring of this KPI for a specific system with the created monitoring profile.
Proceed as follows to execute the monitoring:
-
Go to the Collector jobs tab.
-
Click Create collector job.
-
Fill out the System ID on which you want to monitor the KPI.
-
In the Monitoring profile field, enter ZCUSTOM.
-
Adjust the fields under Period and Retention time according to your requirements.
-
Click (Re)Start collector job.
-
The monitoring is executed.
For information about how to schedule and start a collector job, see the chapter Scheduling the Monitoring of KPIs.
Once the collector job has been executed successfully, you can display the results of your custom KPI on the main screen. For more information about displaying KPIs, see the chapter Displaying KPIs.
Creating a KPI via an SQL SELECT Statement
You can create a custom KPI by defining a valid SQL SELECT statement. You specify the SQL statement for a custom KPI in the Collector for User-defined SQL.
To create a KPI through an SQL SELECT statement, see the chapter Creating a KPI by Defining an SQL SELECT Statement.
For more information about this collector, see the chapter Collector for User-defined SQL.
In addition, you can find an example in the chapter Example: Number of Inactive Objects on the System
Wizard for KPI Creation Based on an SQL Statement
You can create a new custom KPI based on the SQL statement with the KPI wizard. The wizard enables you to:
-
Create a custom KPI definition with its long description
-
Assign the monitoring profile and KPI group
-
Define an SQL statement for KPI calculation
-
Define an SQL statement for KPI details (optional)
-
Schedule the collector job for monitoring the custom KPI (optional)
The above mentioned points are represented as separate screens through which you set up the entire KPI monitoring. The KPI wizard will guide you through these steps. Once you confirm the setup, the KPI is ready for monitoring.
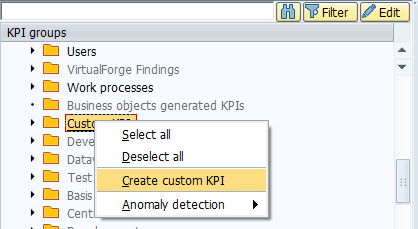
KPI Wizard
You can start the KPI wizard from the KPI groups context menu by right-clicking Custom KPI and selecting Create custom KPI. The KPI wizard is displayed. You must complete all of its steps.
Wizard steps
The KPI wizard contains several steps. The function of each step is explained in more detail in the following chapters.
If CrystalBridge® Monitoring is integrated into AppDynamics, then one additional step AppDynamics Mapping is available in the wizard. In this step, you can integrate a new KPI with AppDynamics metrics. 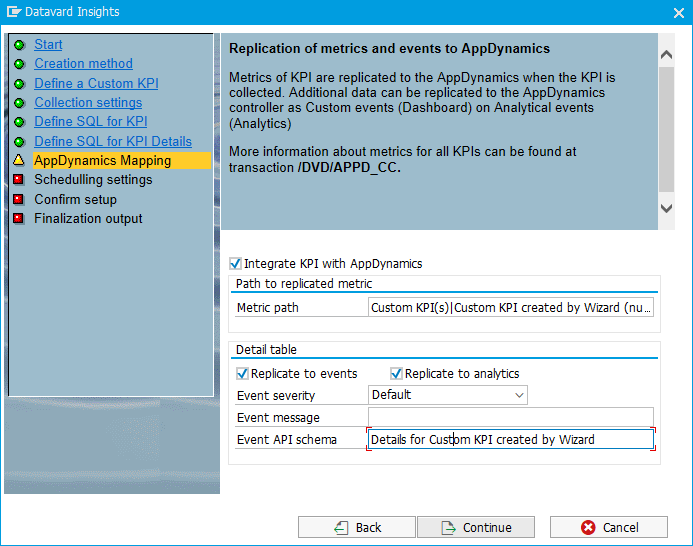
For more information about mapping a KPI with the AppDynamics metrics outside of the wizard, see the chapter Mapping Between AppDynamics Metrics and CrystalBridge® Monitoring KPIs.
Start
The start screen of the KPI wizard displays a short description of the wizard.
Creation method
This step allows you to choose a method for the KPI creation. For now, only the method for KPI creation by SQL statement is available. The creation of a KPI based on an SQL statement only makes sense for remote systems. That is the reason why you cannot change the predefined values Remote system and System.
Define custom KPI
This step allows you to define the KPI.
The following options are available:
-
KPI name: Enter the name of a custom KPI that does not exist on the system. If you enter the name of a KPI that already exists, the message KPI &1 already exists! appears.
-
Description: Enter a short description of the KPI that is displayed in the KPI chart or other outputs as the KPI label.
-
Collector: Enter the name of the collector that calculates the KPI. Because you define a KPI based on an SQL statement, the general collector /DVD/MON_CL_COL_SQL is used.
NOTE The collector /DVD/MON_CL_COL_SQL is a general collector for calculating the KPIs via their defined SQL statements. For more information about this collector, see the chapter Collector for User-defined SQL.
-
Unit (recommended): Enter the unit of measurement that is displayed next to the KPI value in the chart.
-
Decimals (optional): Enter the number of decimals that is displayed in the chart. An empty field means that no decimals are displayed.
-
Monitoring area: Enter the monitoring area of a system that is specific for the KPI. A KPI is collected only for specific monitoring areas, such as SAPSYS, BW, ERP, CRM, SRM, etc. To select a monitoring area, use the search help (F4), which displays only existing monitoring areas.
NOTE If you want to change the monitoring area value from SAPSYS to another value, always check whether this area is assigned to the system on which you want to monitor this KPI. For more information, see the chapter Assign Monitoring area to System.We recommend using the predefined value SAPSYS. If you define the non-existing monitoring area, the message Monitoring area &1 does not exist is displayed. In such a case, you can use the F4 help to display the list of existing monitoring areas.
-
Long description (optional): You can enter a long description of the KPI by clicking Long Description. A long description of the KPI is then displayed in the KPI info pop-up and in the KPI charts.
-
Chart settings (optional)
NOTE There are predefined values for displaying a KPI in the chart. If you want to change these settings, you can click Chart settings to display a pop-up where you can change the default values.This area allows you to set the lower and upper limits for displaying your KPI chart.
-
Lower/Upper limit mode: Specifies the mode according to which your KPI chart is displayed:
-
Limit is calculated from minimum/maximum values
-
Limit is a fixed value
-
Limit is calculated from fixed and minimum/maximum values
-
-
Lower/Upper limit value: Specifies the value of the selected limit mode, based on which your KPI is displayed in the KPI charts.
-
Chart line type: Specifies the type of chart line. The following options are available:
-
Simple line
-
Spline line
-
Discrete line
-
-
Logarithmic Y scale: If selected, Y-axis labels are shown as values of the common logarithm (decimal).
-
-
Don't display KPI in charts: If selected, the KPI is not displayed in the KPI charts or the KPI group list. For example, you can select this field if you want to use the KPI value for other KPI calculations or aggregations.
Collection settings
In this step, you must define a monitoring period for the KPI. You can also assign a KPI group under which the KPI will be displayed in the KPI tree.
The following options are available:
-
Period
If you define a period for which more than one monitoring profile with the same period already exists, the selection tree is displayed. You can only assign one monitoring profile for KPI calculation.
NOTE You can modify the description and retention time only for the custom monitoring profile (technical name starting with Y* or Z*). Default monitoring profiles cannot be changed.Otherwise, if the monitoring profile does not exist with the provided period, a new custom monitoring profile name is generated. You can only generate custom monitoring profiles starting with Y* or Z*.
-
Assign KPI group
You can assign a different KPI group by clicking Change KPI group. The KPI group selection tree is displayed. Select only one KPI group from the tree.
NOTE By default, the predefined KPI group is defined by the group that is selected when opening the KPI group context menu to start the wizard. You cannot change the description of an existing KPI group. If you enter the name of a KPI group that does not exist, you must also specify its description. This KPI group will be automatically created at the end of the wizard.
Define SQL for KPI
You must provide a valid SQL statement for KPI calculation. This SQL statement needs to return a number value. This step also provides two examples of how to define a valid SQL statement:
-
Example 1: Provides an SQL statement that calculates the number of locked system users.
-
Example 2: Provides an SQL statement that calculates the number of canceled BTC jobs from the last run. This example also includes the use of placeholders.
You can display the list of available placeholders can by clicking Placeholders. For more information, see the chapter Placeholder Usage.
If you want to execute the provided SQL statement on any remote SAP system defined in CrystalBridge® Monitoring, you can change the value in the field System ID for SQL execution. If you are using the remote scenario, the user defined in the configured RFC destination for the changed system ID must have a valid CrystalBridge® Monitoring authorization role assigned in order to run a central monitoring instance. If this user does not have sufficient authorizations, the error message You are not authorized to run central monitoring instance! is displayed.
You can click Test SQL to check whether the provided SQL statement is valid for the SAP system that is defined in the field System ID for SQL execution.
If the provided SQL statement contains any special white characters (e.g. new lines, horizontal tabs, etc.), these characters are automatically deleted when testing the provided SQL statement. In addition, the input string is automatically formatted in the correct format without these special characters.
If you select any data from a table starting with a slash (e.g. tables with the prefix /DVD/MON*), you must insert these table names with double quotation marks. Example: SELECT count(*) FROM "/DVD/MON_TABLE" WHERE ...
Define SQL for KPI details (optional)
By default, the collection of KPI details is disabled. If you want to collect KPI details, you must select the Use SQL details option. A technical name of the detail table is generated with its description, but you can modify it. Here, you must ensure that the detail table name does not exist yet.
The second step is to define SQL statements to collect KPI details. In this SQL statement, you must manually enumerate the list of fields separated by commas. As in the previous step, two examples are available for SQL statements for the collection of KPI details.
For more information about placeholders for the detail table, see the chapter Placeholder Usage.
Scheduling settings
You can schedule a collector job for KPI monitoring directly through the wizard. The wizard checks whether the collector job for the provided monitoring profile and system ID is already running or not. There can be multiple scenarios:
-
Collector job does not exist: The message Collector job &1 does not exist is displayed. You can select the Schedule collector job option to create and start a new collector job.
-
Collector job is not scheduled: The message Collector job &1 is not scheduled is displayed. You can select the Schedule collector job option to start the existing collector job.
-
Collector job is running: The message Collector job &1 is running is displayed. In this scenario, the Schedule collector job option is not displayed.
-
Collector job is paused: The message Collector job &1 is paused is displayed. You can select the Schedule collector job option to resume the existing collector job.
When the collector job is already running, in the next step, you will be prompted to confirm whether you want to restart the collector job and add a new KPI to the monitoring. Click Yes to restart the collector job and start the monitoring of the KPI immediately.
Confirm setup
This step serves as a confirmation of the custom KPI setup. Click Complete to save all of the entries provided in the previous steps.
Finalize output
This is the last step of the wizard. The area below displays the output as the result of the KPI setup.
Creating a KPI by Defining an SQL SELECT Statement
This chapter explains how to create a KPI by defining an SQL SELECT statement. To do so, you can use a Wizard for KPI Creation Based on an SQL Statement.
Proceed as follows to create a custom KPI that collects data according to the specified SQL statement:
Step 1: Define a custom KPI
Define the custom KPI as described in the chapter Defining a Custom KPI. After creating the KPI definition, return to this page to complete the creation of a custom KPI.
Step 2: Choose how data is collected in the custom KPI through an SQL SELECT statement
-
Click Settings > Collector settings. Alternatively, you can start transaction /DVD/MON_COL.
-
Select the collector /DVD/MON_CL_COL_SQL. You can search for the name of a collector by pressing Shift+F7.
-
Double-click Collector > Inputs & rules.
-
Click Edit in the column next to the input table /DVD/MON_KPISQL1 (table for KPIs).
-
Click
 Switch mode (Ctrl+F1) and then
  Create new records (F6).
 -
In the next window, enter the name of your custom KPI and fill out the SQL statement.
Comments for SQL Statements
If you want to retain certain SQL statements for future use without executing them within the SQL collector, you can comment them out by adding '--' at the beginning of the SELECT statement. If you cannot add two extra characters to the row due to the maximum character limit of 128 in one row, we recommend overwriting the first two characters of the SELECT statement (use '--LECT' instead of 'SELECT'). The comment function is supported for both input tables /DVD/MON_KPISQL1 and /DVD/MON_KPISQL2.
In your SQL statement, you can use a placeholder. These placeholders allow you to create a more generic SQL statement. By default, these placeholders are replaced by relevant values directly in the SQL statement when the SQL collector is executed.
|
Placeholder |
Returning value of |
|
|---|---|---|
|
<LASTRUN> |
Last run |
|
|
<TIMESTAMP> |
Timestamp |
|
|
<SID> |
System ID |
|
|
<FIRST_START> |
First start |
|
|
<SERVER> |
Server |
|
|
<HOST> |
Host |
|
|
<DATE_FROM> |
Date from |
|
|
<TIME_FROM> |
Time from |
|
|
<DATE_TO> |
Date to |
|
|
<TIME_TO> |
Time to |
|
|
<MANDT> |
Client ID |
|
Bind variables
If supported by the database, you can enable bind variable usage for SQL statements. For more information, see the chapter Bind Variables.
-
Click Save.
-
The next step is to specify the monitoring profile of a KPI, as described in the chapter Defining Monitoring Profiles for KPIs.
In the Collector for User-defined SQL, it is possible to create a detail table, which displays further KPI details. For more information, see the chapter Creating a Detail Table for a Custom KPI Assigned to the Collector for User-defined SQL.
You can find an example in the chapter Example: Number of Inactive Objects on the System.
Example: Number of Inactive Objects on the System
This example shows how to create your KPI to collect information about the number of inactive objects on the monitored system.
Step 1: Define a custom KPI for the SQL collector
-
Start transaction /DVD/MON and click Settings > Collector settings. Alternatively, you can start transaction /DVD/MON_COL.
-
Select the collector /DVD/MON_CL_COL_SQL.
-
Double-click KPI.
-
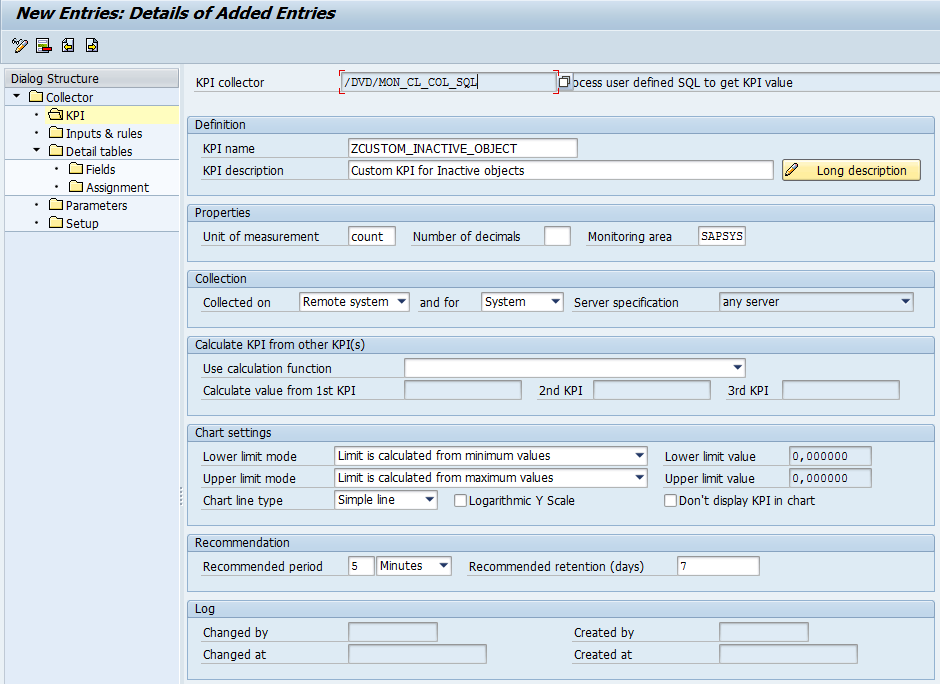
Click New Entries.
-
Fill out all the required fields for the custom KPI as shown in the figure below. You can find a list of all the field descriptions in the chapter Defining a Custom KPI.
-
Click Save.
Step 2: Choose how data is collected in the custom KPI through an SQL SELECT statement
-
Double-click Collector > Inputs & rules.
-
Click Edit in the column next to the input table /DVD/MON_KPISQL1 (table for KPIs).
-
Click
Switch mode (Ctrl+F1) and then Create new records (F6). -
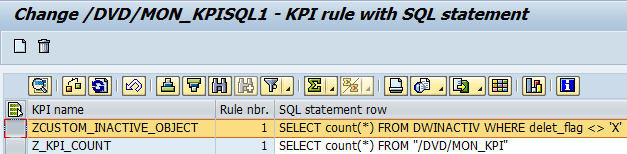
Enter the KPI name ZCUSTOM_INACTIVE_OBJECT.
-
Fill out the SQL statement row column. The SQL statement for inactive objects is SELECT count(*) FROM DWINACTIV WHERE delete_flag <> 'X'.
-
Click Save.
-
The custom KPI for the SQL collector has been defined.
Creating a Monitoring Profile for a Custom KPI
Before you start to collect a custom KPI, you must assign it to a monitoring profile.
Proceed as follows to create a custom monitoring profile and assign it to this custom KPI:
-
Start transaction /DVD/MON and click Settings > Monitoring settings. Alternatively, you can start transaction /DVD/MON_CUST.
-
Double-click Profile definition.
-
Click New Entries.
-
Enter ZCUSTOM as the profile name.
-
Double-click Assigned KPIs.
-
Click New Entries.
-
Enter ZCUSTOM_INACTIVE_OBJECT as the custom KPI name.
-
Click Save.
-
The custom KPI ZCUSTOM_INACTIVE_OBJECT is now assigned to the valid monitoring profile ZCUSTOM.
Scheduling the Monitoring of a Custom KPI
The last step is to execute the monitoring of this KPI for a specific system with the created monitoring profile.
Proceed as follows to execute the monitoring:
-
Go to the Collector jobs tab.
-
Click Create collector job.
-
Fill out the System ID on which you want to monitor the KPI.
-
In the Monitoring profile field, enter ZCUSTOM.
-
Adjust the fields under Period and Retention time according to your requirements.
-
Click (Re)Start collector job.
-
The monitoring is executed.
For information about how to schedule and start a collector job, see the chapter Scheduling the Monitoring of KPIs.
Once the collector job has been executed successfully, you can display the results of your custom KPI on the main screen. For more information about displaying KPIs, see the chapter Displaying KPIs.
Creating a KPI via Collectors with a Custom KPI
You can create a custom KPI and assign it to preconfigured default collectors with a custom KPI. The advantage of the collectors with a custom KPI is that you do not need to create your own collector in ABAP.
If you decide to create a custom KPI via these types of collectors, you must first choose a collector that meets your requirements. After that, you can create a custom KPI as described in the chapter Creating a Custom KPI via a Collector with a Custom KPI.
In addition, you can find an example in the chapter Example: Number of Type Conflicts when Calling a FORM.
Creating a Custom KPI via a Collector with a Custom KPI
Each collector has different program logic, which it uses to calculate and create a different KPI. Therefore, if you decide to create a custom KPI via these types of collectors, you must first choose a collector meets your requirements. To do so, see the chapter List of Collectors with a Custom KPI.
You can find an overview of the complete process of custom KPI creation in the chapter The Complete Process of Custom KPI Creation and Data Collection.
Step 1: Choose a collector that meets your requirements
In the chapter List of Collectors with a Custom KPI, choose a collector meets your requirements.
Step 2: Define a custom KPI
Define the custom KPI as described in the chapter Defining a Custom KPI. After you have created the KPI definition, proceed to step 3 below to complete the creation of the custom KPI.
During the KPI definition, fill out the field KPI collector with the technical name of the collector that you chose in step 1.
Step 3: Choose how data is collected in the custom KPI by editing the collector
-
Click Settings > Collector settings. Alternatively, you can start transaction /DVD/MON_COL.
-
Select the collector that you chose in step 1. You can search for the name of a collector by pressing Shift+F7.
-
Double-click Collector > Inputs & rules.
-
Click Edit in the column next to the input table name. If the collector contains multiple input tables, select the one that meets your requirements.
You can find descriptions of input tables via the relevant collector in the chapter List of Collectors with a Custom KPI.
-
Click
Switch mode (Ctrl+F1) and then Create new records (F6). -
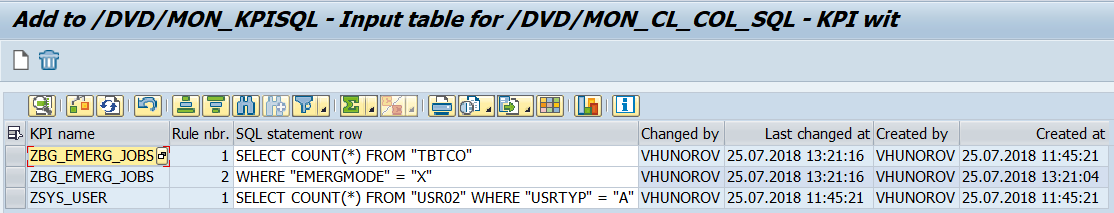
Enter the name of your custom KPI and create a new rule for this KPI.
-
Define the independent fields of the rule.
Every row represents one rule that defines the collection of a KPI. AND logic is applied between these fields, for example KPI name, Rule nr., Unit, etc. If you define multiple rules (rows) for a KPI, OR logic is applied between these rows. In this case, enter the rule order in the Rule nr. fields.
-
Click Save.
The next step is to specify the monitoring profile of a KPI, as described in the chapter Defining Monitoring Profiles for KPIs.
In addition, you can find an example in the chapter Example: Number of Type Conflicts when Calling a FORM.
Example: Number of Type Conflicts when Calling a FORM
This example shows how to create your own KPI that collects information about how many times the error Type conflict when calling a FORM occurred.
Step 1: Define a custom KPI
-
Start transaction /DVD/MON and click Settings > Monitoring settings. Alternatively, you can start transaction /DVD/MON_CUST.
-
Click New entries.
-
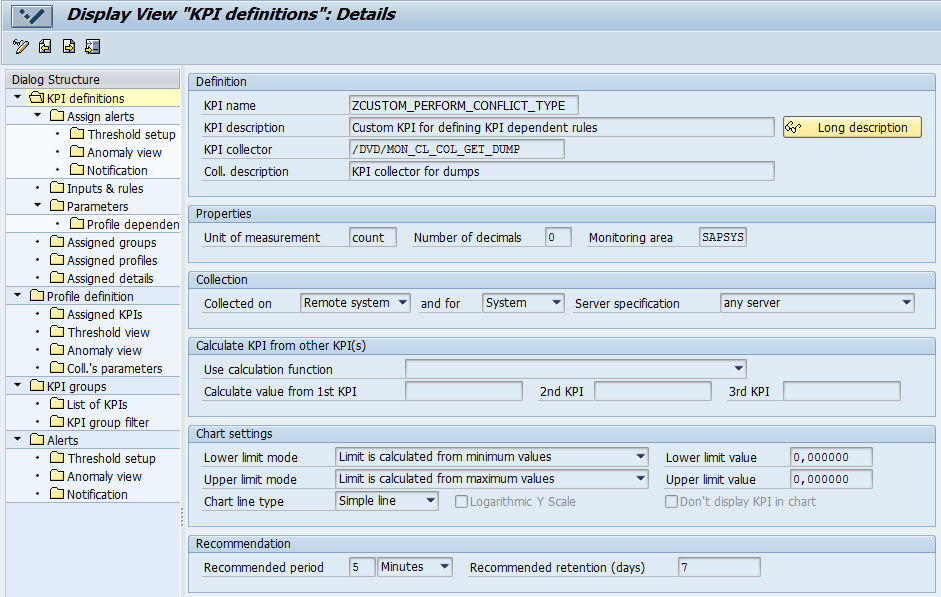
Fill out all the required fields for the custom KPI as shown in the figure below:
-
In the KPI name field, enter ZCUSTOM_PERFORM_CONFLICT_TYPE.
-
In the KPI description field, enter a unique description.
-
In the KPI collector field, enter /DVD/MON_CL_COL_GET_DUMP.
-
Fill out the other fields for the custom KPI as shown in the figure below. You can find a list of all the field descriptions in the chapter Defining a Custom KPI.
-
-
Click Save.
Step 2: Choose how data is collected in the custom KPI via a collector job
-
Click Settings > Collector settings. Alternatively, you can start transaction /DVD/MON_COL.
-
Select the collector /DVD/MON_CL_COL_GET_DUMP.
-
Double-click Collector > Inputs & rules.
-
Click Edit in the column next to the input table /DVD/MON_DUMP_I1.
-
Click
Switch mode (Ctrl+F1) and then Create new records (F6). -
Define a new rule:
-
In the KPI name column, enter your custom KPI name ZCUSTOM_PERFORM_CONFLICT_TYPE.
-
In the Rule nr. column, enter 1.
-
In the ABAP Runtime Error column, enter the technical name of the dump: PERFORM_CONFLICT_TYPE.
-
Set the Active column to X.
-
Optional: Set the Into det. column to X if you want to collect the KPI details in a detail table.
-
In the Description column, enter a suitable description.
-
-
Click Save.
-
You have now created the new custom KPI ZCUSTOM_PERFORM_CONFLICT_TYPE, which collects information about how many times the error Type conflict when calling a FORM occurred.
Creating a Monitoring Profile for a Custom KPI
Before you start to collect the created KPI, you must assign it to a monitoring profile.
Proceed as follows to create a custom monitoring profile and assign it to a custom KPI:
-
Start transaction /DVD/MON and click Settings > Monitoring settings. Alternatively, you can start transaction /DVD/MON_CUST.
-
Double-click Profile definition.
-
Click New Entries.
-
Enter ZCUSTOM as the profile name.
-
Double-click Assigned KPIs.
-
Click New Entries.
-
Enter ZCUSTOM_PERFORM_CONFLICT_TYPE as the custom KPI name.
-
Click Save.
-
The custom KPI ZCUSTOM_PERFORM_CONFLICT_TYPE is now assigned to the monitoring profile ZCUSTOM.
Scheduling the Monitoring of a Custom KPI
The last step is to execute the monitoring of this KPI for a specific system with the created monitoring profile.
Proceed as follows to execute the monitoring:
-
Go to the Collector jobs tab.
-
Click Create collector job.
-
Fill out the System ID on which you want to monitor the KPI.
-
In the Monitoring profile field, enter ZCUSTOM.
-
Adjust the fields under Period and Retention time according to your requirements.
-
Click (Re)Start collector job.
-
The monitoring is executed.
For more information about how to schedule and start a collector job, see the chapter Scheduling the Monitoring of KPIs.
Once the collector job has been executed successfully, you can display the results of your custom KPI on the main screen. For more information about displaying KPIs, see the chapter Displaying KPIs.
Creating a KPI with a Custom Collector in ABAP
If the methods mentioned before do not meet your requirements for a custom KPI, you can create a KPI with a custom collector in ABAP code. This feature is only available to advanced users with ABAP knowledge.
To create a custom KPI with a custom collector, follow the instructions described in the chapter Custom Collectors.
You can find an overview of the complete process of custom KPI creation in the chapter The Complete Process of Custom KPI Creation and Data Collection.
Defining a Custom KPI
When defining a KPI, you can set up how a custom KPI is displayed in charts, from where it is collected, and other settings mentioned below.
Before you define a new custom KPI for the first time, you must choose a collector that defines how data is collected in the KPI. You choose a collector based on the method of KPI creation, which you select in the step Creating a Custom KPI.
It is also possible to return to the KPI creation step and adjust the definition of a custom KPI.
You can find an overview of the complete process of custom KPI creation in the chapter The Complete Process of Custom KPI Creation and Data Collection.
Proceed as follows to define a custom KPI:
-
Start transaction /DVD/MON and click Settings > Monitoring settings. Alternatively, you can start transaction /DVD/MON_CUST.
-
Double-click KPI definitions.
-
Click New Entries.
-
Fill out all the required fields as shown in the figure below and click Save.

Definition
-
KPI name: Specifies the case-sensitive name of a custom KPI.
NOTE Your KPI name must start with a capital Y* or Z* because the standard customizing (field entries except the ones starting with Y* or Z*) cannot be changed or added.
-
KPI description: Specifies the description that is used as the KPI label in the KPI charts and other output.
-
Long description (optional): Specifies the long description of a KPI that is displayed in the KPI information pop-up and the KPI charts.
-
KPI collector: Determines which collector collects the KPI. Select a collector according to the type of KPI you are creating. You can use the search help by pressing F4.
NOTE If you create a custom KPI from the existing KPIs, we recommend using the collector /DVD/MON_CL_COLLECTOR. For more information, see the section Calculate KPI from Other KPI(s).
Properties
-
Unit of measurement: Specifies the unit of measurement that is displayed next to the KPI value in the chart.
-
Number of decimals: Specifies the number of decimals that is displayed in the chart. An empty field means that no decimals are displayed.
-
Monitoring area: Specifies the monitoring area of the system, which is specific for a KPI. A KPI is collected only for specific monitoring areas, such as ERP, BW, CRM, SRM, etc.
To select a monitoring area, use the search help (F4), which displays only monitoring areas that are supported for the system on which the KPI is collected.
NOTE If you enter a monitoring area that is not supported for the monitored systems, the message KPI is suitable only for system type &1 appears.
Collection
-
Collected on: Specifies the system on which the KPI is collected or calculated. Possible values: Remote system; Central system.
NOTE Select Central system if you are creating a KPI from an existing KPI. For more information, see the section Calculate KPI from Other KPI(s).
-
and for: Specifies whether the KPI value is calculated for a system or at the server level.
NOTE Specify this field according to the collector you selected previously. For example, the KPI Size of a table is a system KPI, and the KPI CPU load is a server-dependent KPI.
-
Server specification: Specifies the server type. If you have selected Server in the above field and for, you choose among the following server types:
-
Any server
-
Only application server
-
Only database server
-
Only external server
-
Calculate KPI from Other KPI(s) (Optional)
This area is optional. It allows you to create a KPI from already existing KPIs. For more information about calculation functions, see the chapter Creating a KPI from an Existing KPI Based on a Calculation Function.
If you do not want to use this option, leave the fields in this area empty.
Chart settings (optional)
This area allows you to set the lower and upper limits for displaying your KPI chart.
-
Lower/Upper limit mode: Specifies the mode according to which your KPI chart is displayed:
-
Limit is calculated from minimum/maximum values
-
Limit is a fixed value
-
Limit is calculated from fixed and minimum/maximum values
-
-
Lower/Upper limit value: Specifies the value of the selected limit mode, based on which your KPI is displayed in the KPI charts.
-
Chart line type: Specifies the type of chart line. The following options are available:
-
Simple line
-
Spline line
-
Discrete line
-
-
Logarithmic Y scale: If selected, Y-axis labels are shown as values of the common logarithm (decimal), i.e. as a logarithmic scale instead of a linear one.
-
Don't display KPI in charts: If selected, the KPI is not displayed in the KPI charts or the KPI group list. For example, you can select this field if you want to use the KPI value for other KPI calculations or aggregations.
Recommendation (optional)
-
Recommended period: Displays a recommendation for how often the KPI should be collected. This field serves only as information for other users about the period they should enter when starting the monitoring of this KPI.
-
Recommended retention (days): Displays a recommended time for the storage of KPI data in the system before this data is deleted. This field serves only as information for other users about the retention time that they should specify when scheduling the monitoring of this KPI.
Log
-
Changed by: Displays the last user who changed the KPI definition.
-
Changed at: Displays the time of the last change.
-
Created by: Displays the user who created the KPI definition.
-
Created at: Displays the time of the creation.
Editing a Custom KPI
It is possible only to edit the definition of custom KPIs starting with Y* or Z*.
The next step for the creation of a custom KPI depends on the collector:
-
If you have chosen the Collector for User-defined SQL, see the step Creating a KPI by Defining an SQL SELECT Statement.
-
If you have chosen a collector with a custom KPI, see the step Choose how data is collected in the custom KPI by editing the collector.
-
If you have chosen a custom collector with a custom KPI, see the step Implement the logic of a custom collector.